Blog
Why Your Homelab Needs Self-Healing Infrastructure (And How to Build It with Ansible)

Table of Contents
You built a homelab to learn. You deployed Nextcloud, a reverse proxy, maybe Pi-hole or a wiki. It worked. You were proud.
Then something broke at 11pm on a Wednesday. You SSH’d in, fixed it, went to bed. A month later, something else broke. You fixed that too. Six months in, you’re running an on-call rotation for infrastructure nobody is paying you to maintain.
The homelab you built to learn became the homelab you’re afraid to touch.
This is the trajectory of every homelab that treats infrastructure as a one-time setup instead of an ongoing system. The fix isn’t more dashboards or better uptime checks. It’s infrastructure that detects its own problems and fixes the ones it knows how to fix.
The real cost of manual ops
The standard homelab monitoring setup is Uptime Kuma or a Grafana dashboard. Both are good at telling you something is wrong. Neither does anything about it.
So here’s what actually happens: a container crashes at 2am. Your phone buzzes. You roll over, think “I’ll deal with it in the morning,” and fall back asleep. In the morning, you SSH in, run docker restart, confirm it’s back, and move on. Total time spent: 3 minutes. Total disruption to your evening: 100%.
Now multiply that by every failure mode in your stack. Disk fills up. A systemd service fails after an update. Caddy’s TLS renewal stalls. Each one is a 3-minute fix that demands your attention at the worst possible time.
The pattern is always the same: detect, SSH in, run a command, verify, close the terminal. If the fix is that predictable, a computer should be doing it.
The self-healing loop
A self-healing homelab has four components:
- Metrics collection — Prometheus with node_exporter on every host. CPU, memory, disk, container health, systemd service state.
- Alert rules — Prometheus evaluates conditions like “disk usage > 85%” or “container not running for 2 minutes” and fires alerts.
- A remediation dispatcher — A small service that receives alerts via webhook, looks up the right Ansible playbook, and runs it against the affected host.
- Remediation playbooks — Short, single-purpose Ansible playbooks that fix one thing.
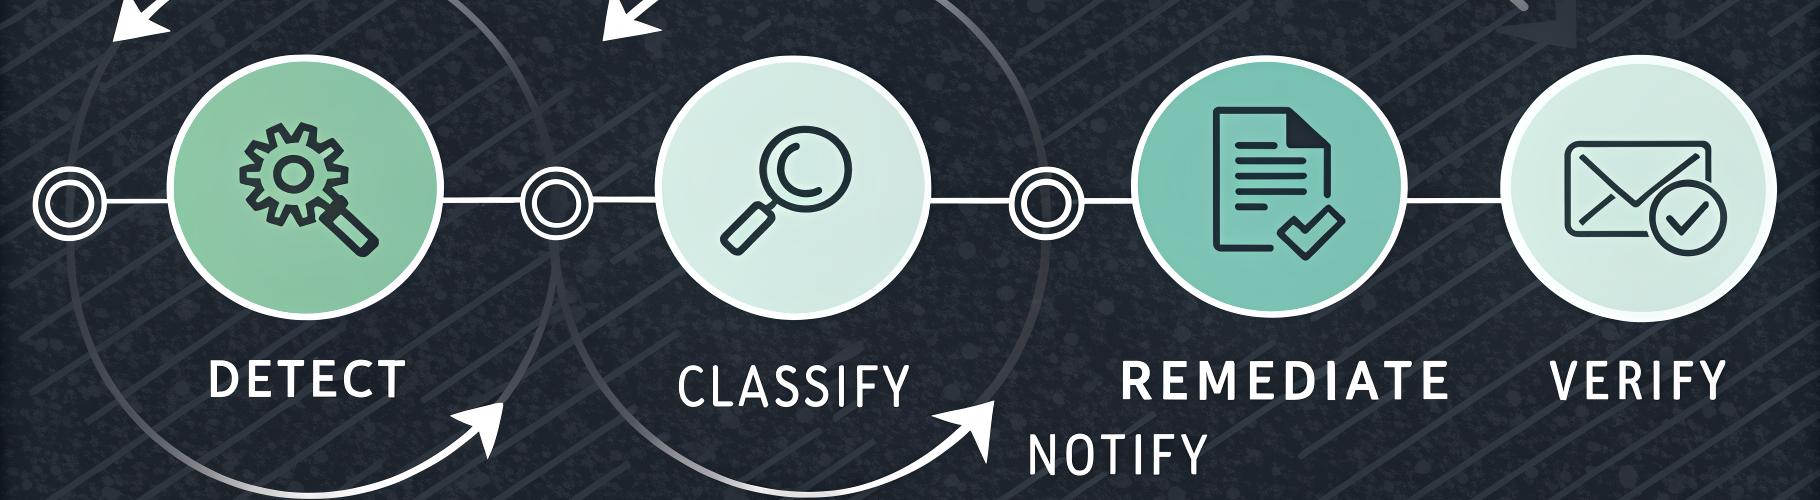
The loop closes automatically: Prometheus detects the problem, Alertmanager fires, the dispatcher runs the fix, you get a notification that says “handled it.”
Total elapsed time from failure to fix: under 60 seconds. Total human involvement: zero.
Three Ansible patterns that make this work
You don’t need a massive playbook collection to start. These three patterns cover roughly 80% of homelab failures.
1. Restart a crashed container
# remediation/restart-container.yml
- name: Restart crashed container
  hosts: "{{ target_host }}"
  become: true
  tasks:
    - name: Get stopped containers
      command: docker ps -a --filter "status=exited" --format "{% raw %}{{.Names}}{% endraw %}"
      register: stopped
      changed_when: false

    - name: Restart via docker compose
      command: docker compose up -d
      args:
        chdir: "/opt/{{ item }}"
      loop: "{{ stopped.stdout_lines }}"
      when: stopped.stdout_lines | length > 0
The target_host variable comes from the dispatcher — it extracts the hostname from the Alertmanager webhook payload. The playbook doesn’t need to know which container crashed. It finds stopped containers and brings them back up using the compose file that originally defined them.
2. Clean disk space before it becomes a crisis
# remediation/cleanup-disk.yml
- name: Clean disk space
  hosts: "{{ target_host }}"
  become: true
  tasks:
    - name: Prune old journal logs
      command: journalctl --vacuum-time=7d
      changed_when: true

    - name: Remove unused Docker images
      command: docker image prune -af
      when: "'docker' in group_names"
      changed_when: true

    - name: Clean apt cache
      apt:
        autoclean: true
      when: ansible_os_family == "Debian"
This fires when Prometheus reports disk usage above 85%. Journal logs and unused Docker images are the two biggest space consumers on a typical homelab host. Cleaning them buys you time. If the alert fires again after cleanup, the dispatcher’s cooldown prevents a loop — the second alert pages you, because it’s a problem that needs human judgment.
3. Detect drift before it causes outages
This one isn’t a remediation — it’s prevention. Run your playbooks in check mode weekly:
ansible-playbook deploy-docker-fleet.yml --check 2>&1 \
  | grep -c "changed="
If the count is zero, your hosts match your code. If it’s nonzero, something drifted — a config file edited by hand, a package version that bumped, a service in an unexpected state. Fix the drift before it becomes an outage.
Idempotency is Ansible’s superpower here. A playbook that ran cleanly last week should still run cleanly this week. If it doesn’t, the delta is your drift report.
The dispatcher: 200 lines that close the loop

The piece that ties it all together is a remediation dispatcher — a small service that maps Prometheus alert names to Ansible playbooks. The mapping is a YAML file:
mappings:
  ContainerDown:
    playbook: remediation/restart-container.yml
    cooldown_minutes: 10
  DiskSpaceHigh:
    playbook: remediation/cleanup-disk.yml
    cooldown_minutes: 60
  SystemdServiceFailed:
    playbook: remediation/service-restart.yml
    cooldown_minutes: 15
Adding a new remediation is adding three lines of YAML. No code changes, no restart. The dispatcher reads the map fresh on every webhook.
The cooldown prevents remediation loops. A container that keeps crashing every 2 minutes (bad config, OOM kill) gets restarted once. The second crash pages you — that one needs a human.
The full implementation — including the dispatcher, all remediation playbooks, Prometheus alert rules, and fleet-wide monitoring deployment — is open source: ops-kernel-stack. Clone it, swap in your hostnames, and deploy.
Start small, automate outward
You don’t need to build all of this in a weekend. Start with one thing: deploy node_exporter to your fleet with a single Ansible playbook. That gives you metrics. Add Prometheus and one alert rule. Add one remediation playbook for your most common failure. Then iterate.
The point isn’t to automate everything on day one. It’s to stop being the single point of failure for problems that have known, scriptable fixes.
If you want a step-by-step walkthrough of building this stack from scratch — including Proxmox provisioning, DNS, reverse proxy, backups, and the full remediation bridge — the companion ebook covers all of it:
My Homelab Fixes Itself — the ebook walks through every layer, from first Ansible playbook to a fully self-healing infrastructure.
The Ansible Homelab Cheat Sheet is a free quick-reference for the patterns and commands used throughout this post.
Your homelab should work for you, not the other way around. The tools are all free, the patterns are straightforward, and the first automated remediation that runs while you sleep will make the whole setup feel worth it.
Questions? Open an issue on GitHub or email hello@opskern.io.