Blog
Your Infrastructure Should Report to You — Not the Other Way Around

Table of Contents
Last Thursday morning I opened Grafana, scanned the dashboards, and closed the tab. Everything looked fine. At 2pm a customer mentioned their backups hadn’t run in three days. The data was on the dashboard — I’d looked right at it and missed it.
That is the failure mode of dashboard-based monitoring. The information is there, but it only becomes knowledge when a human notices it. We built a morning briefing that reverses the flow: every day at 8am, the infrastructure tells you what happened overnight, what is healthy, and what needs attention. If everything is fine, it says so. If something needs you, it finds you.
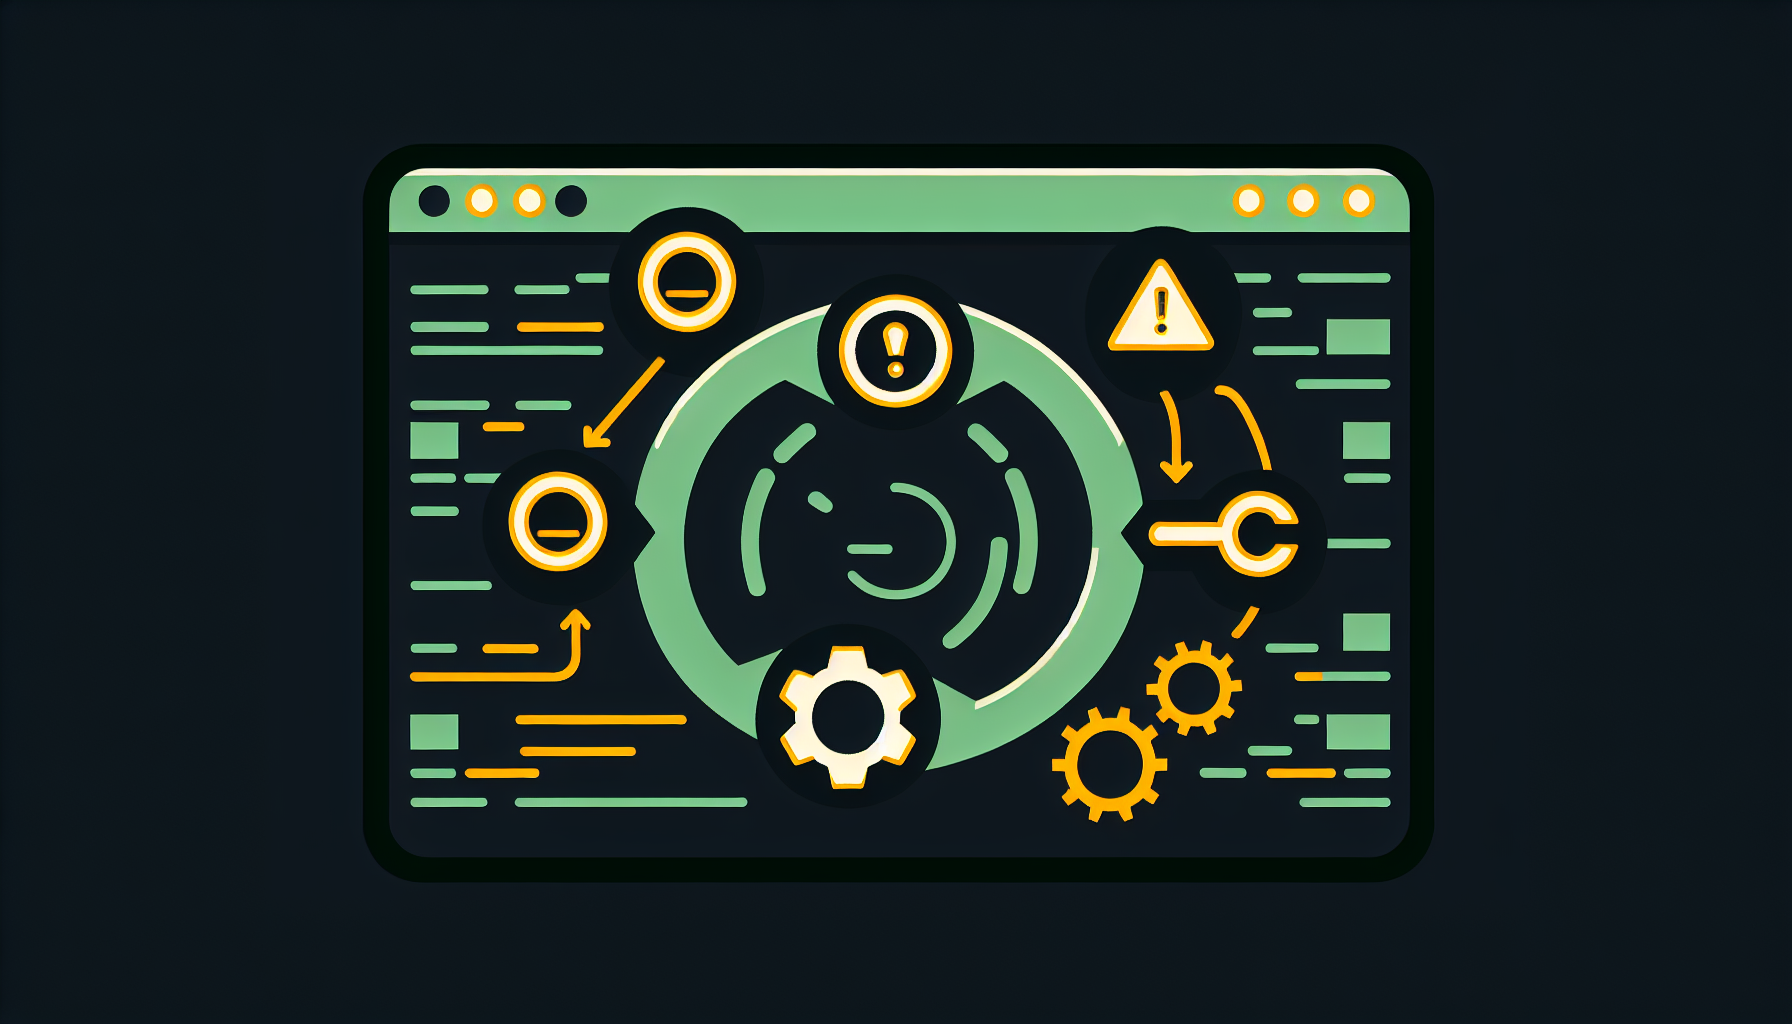
The morning briefing
Every day at 08:00 EST, the system compiles a health summary across the entire managed fleet and delivers it to Slack and mobile push notifications.
The briefing covers four areas. Agent status: how many hosts checked in during the last 24 hours, which ones missed a heartbeat, whether any agents need updating. Alert summary: how many alerts fired overnight, how many auto-remediated, how many still need human attention. Backup health: which jobs succeeded, which failed or were skipped, how old the latest snapshot is for each host. And resource trends — not alerts, but trajectories. “Host X disk usage has grown 3% this week” is more useful at 8am than an alert at 2am when it finally hits 90%.
The whole briefing takes 30 seconds to read. If everything is green, you glance at it and get on with your day. If something needs attention, you know before your first cup of coffee — not when a user reports that something is slow.
Why dashboards are not enough
Dashboards are reactive. They require you to look at them. The information is there, but it only becomes knowledge when a human opens a browser tab and interprets it.
This creates two failure modes:
The first failure mode is fatigue. When everything is usually fine, you stop checking. The dashboard exists, but nobody looks at it until something breaks. By that point, it is showing you the blast radius, not the early warning.
The second is overload. Twelve panels of graphs on a Grafana dashboard are not actionable information. They are raw data that requires interpretation. Most people do not have the time or inclination to interpret them every morning.
The morning briefing solves both by distilling the dashboard into a summary and delivering it proactively. You do not go to the data — the data comes to you, pre-interpreted, with clear action items.
The fleet dashboard
Alongside the morning briefing, we rebuilt the management portal from the ground up. The new fleet dashboard provides:
At-a-glance status. Every host in your fleet shown as a card with a status indicator. Green, yellow, red — you know the state of your entire fleet in a single glance. No clicking, no drilling down, no interpretation needed.
Sparkline charts. Each host card includes a tiny 7-day sparkline showing CPU and memory trends. You can spot hosts that are slowly degrading without opening a single graph. The sparkline tells a story that a current-value gauge cannot.
Search, sort, and filter. When you have 6 hosts, you can scan them visually. When you have 60, you need to search by name, sort by status, and filter by tag. The dashboard scales with your fleet.
Host detail drill-down. Click any host card to see its full timeline — every alert, every remediation action, every backup, every metric anomaly. The timeline view shows you what happened and when, so you can correlate events without digging through log files.
Bulk actions. Select multiple hosts, apply an action. Restart a service across the fleet. Run a security scan on all production hosts. Schedule a maintenance window for a group. Operations that used to require a loop of SSH commands now take a single click.
What proactive reporting looks like in practice

Here is a real example of how the morning briefing changes your workflow:
Without briefing: You wake up. Drink coffee. Eventually open Grafana. Notice that a backup job failed last night. SSH into the backup server. Check the logs. Realize the target disk was full. Clean it up. Re-run the backup. Total time: 45 minutes, spread across the first two hours of your day.
With briefing: You wake up. Your phone shows a notification: “Morning briefing: 5/6 hosts healthy. Backup failure on host-3 — target disk at 94%. Auto-remediation queued pending approval.” You tap approve. Total time: 15 seconds.
The information is the same. The difference is timing and presentation. The briefing found the problem, identified the cause, prepared a fix, and asked for your approval — all before you finished breakfast.
Building your own briefing (DIY version)
You do not need a managed platform to get proactive reporting. Here is a starting point:
1. Write a morning check script. A bash script that checks disk usage, verifies backup timestamps, lists container status, and checks for failed systemd services. Pipe the output to a notification channel.
2. Schedule it with cron. Set it to run at 8am daily and send results to ntfy, Slack, or whatever notification channel you use. Even a simple email works.
3. Iterate on what you include. Start with the basics and add checks as you discover what information you actually want every morning. The first version will be too verbose. The fifth version will be exactly right.
The goal: fewer tabs, more confidence
The underlying philosophy is simple: your infrastructure should require less of your attention over time, not more. Every dashboard you have to check manually is a tax on your morning. Every alert you have to interpret is cognitive overhead.
The morning briefing and fleet dashboard are designed to compress that overhead into a 30-second daily ritual. When everything is fine, you know it without checking. When something needs you, it finds you.
That is what managed infrastructure should feel like — not a second job, but a system that takes care of itself and keeps you informed.